Average Federal Tax Refund by State (Tax Year 2023)
By SmartTaxCalcs Editorial Team · IRS Statistics of Income, tax years 2019 to 2023 · Data retrieved November 4, 2026
Key findings
- The average federal refund was $3,286 per refunded return in tax year 2023, against $2,897 in 2019. It peaked at $3,347 in 2021.
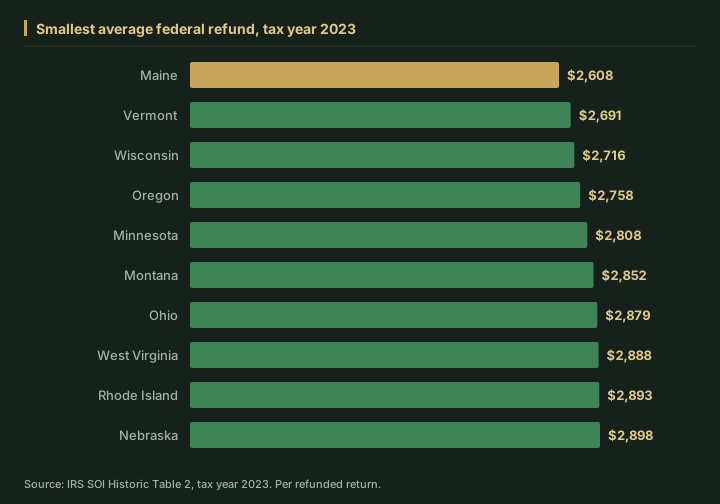
- Texas had the largest average refund ($3,784); Maine the smallest ($2,608).
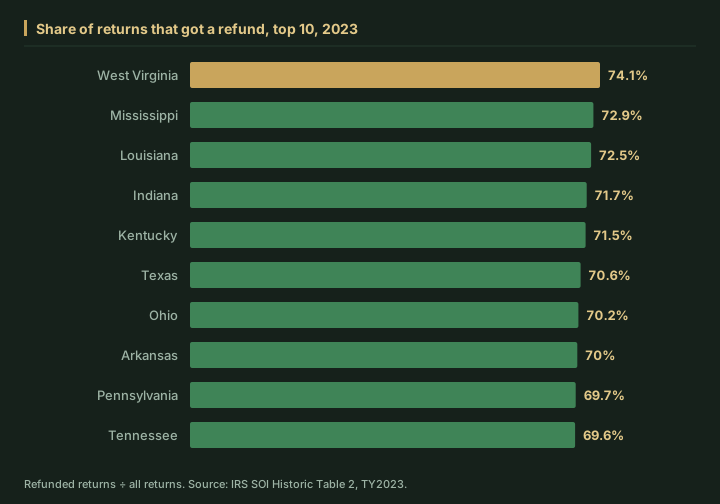
- 66.5% of returns got a refund in 2023, down from 73.2% in 2019.
- Refunds equaled 15.5% of the total tax those returns owed, and about 1.8 weeks of the average AGI per return.
How the numbers are calculated
The IRS Statistics of Income division publishes, for every state, the number of individual returns, their adjusted gross income (AGI), their total tax liability and the number and dollar amount of refunds. It does not publish the averages and ratios below, so we computed them from the all-income totals for each tax year:
- Average refund = refund dollars ÷ number of returns that got a refund
- Share refunded = returns with a refund ÷ all returns
- Refunds as % of AGI = refund dollars ÷ AGI
- Weeks of income = average refund ÷ (average AGI per return ÷ 52)
These are per return, not per household or per person, and they are not adjusted for inflation. Refunds include refundable credits such as the earned income credit and the child tax credit, so a refund is not only over-withheld tax. Tax year 2023 is the latest year the IRS has published by state.
Largest and smallest refunds by state
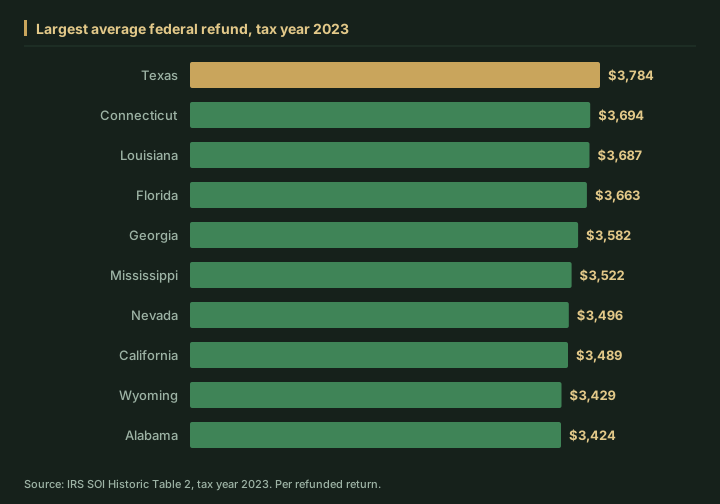
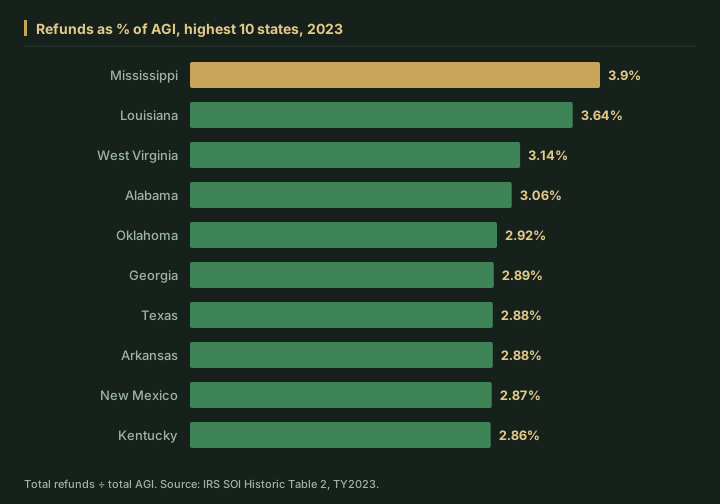
A large average refund does not always mean a large refund relative to income. Texas ranks No. 7 of 51 when refunds are measured against AGI (2.88%).
Refunds relative to income
How refunds changed, 2019 to 2023
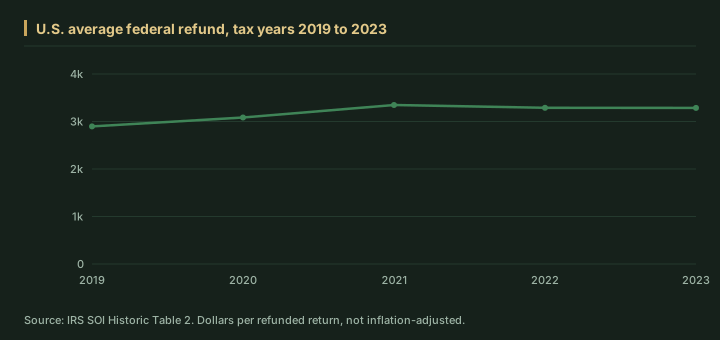
| Tax year | Average refund | Share refunded | Refunds % of AGI | Refunds % of tax owed | Weeks of income |
|---|---|---|---|---|---|
| 2019 | $2,897 | 73.2% | 2.80% | 20.0% | 2 |
| 2020 | $3,085 | 74.1% | 2.99% | 20.7% | 2.1 |
| 2021 | $3,347 | 70.2% | 2.54% | 15.7% | 1.9 |
| 2022 | $3,288 | 67.7% | 2.40% | 15.8% | 1.8 |
| 2023 | $3,286 | 66.5% | 2.29% | 15.5% | 1.8 |
Between 2019 and 2023, the average refund rose most in Connecticut (from $2,981 to $3,694). It rose in every state and DC.
All 50 states and DC, tax year 2023
Sorted by average refund. Use the tax refund estimator to check your own number, or the W-4 calculator if you would rather have more in each paycheck than a large refund.
| State | Returns | Average refund | Share refunded | Refunds % of AGI | Average AGI | Weeks of income |
|---|---|---|---|---|---|---|
| Texas | 13,671,450 | $3,784 | 70.6% | 2.88% | $92,870 | 2.1 |
| Connecticut | 1,822,410 | $3,694 | 65.3% | 1.98% | $121,733 | 1.6 |
| Louisiana | 1,932,540 | $3,687 | 72.5% | 3.64% | $73,322 | 2.6 |
| Florida | 11,218,030 | $3,663 | 66.4% | 2.48% | $98,081 | 1.9 |
| Georgia | 4,881,840 | $3,582 | 67.9% | 2.89% | $84,221 | 2.2 |
| Mississippi | 1,229,590 | $3,522 | 72.9% | 3.90% | $65,863 | 2.8 |
| Nevada | 1,564,590 | $3,496 | 68.7% | 2.51% | $95,528 | 1.9 |
| California | 18,482,300 | $3,489 | 61.8% | 1.94% | $110,960 | 1.6 |
| Wyoming | 282,340 | $3,429 | 66.3% | 2.05% | $110,694 | 1.6 |
| Alabama | 2,140,840 | $3,424 | 69.5% | 3.06% | $77,823 | 2.3 |
| District of Columbia | 348,640 | $3,386 | 62.8% | 1.48% | $143,300 | 1.2 |
| Illinois | 6,100,250 | $3,338 | 68.2% | 2.29% | $99,263 | 1.7 |
| New Jersey | 4,654,080 | $3,332 | 64.2% | 1.91% | $111,864 | 1.5 |
| Alaska | 347,930 | $3,307 | 65.2% | 2.39% | $90,076 | 1.9 |
| Washington | 3,781,890 | $3,286 | 64.7% | 1.85% | $114,848 | 1.5 |
| Oklahoma | 1,702,930 | $3,278 | 69.0% | 2.92% | $77,287 | 2.2 |
| Arkansas | 1,292,190 | $3,270 | 70.0% | 2.88% | $79,492 | 2.1 |
| Arizona | 3,391,030 | $3,265 | 65.2% | 2.38% | $89,405 | 1.9 |
| New York | 9,789,330 | $3,248 | 65.1% | 1.97% | $107,450 | 1.6 |
| Maryland | 3,100,200 | $3,234 | 64.4% | 2.07% | $100,608 | 1.7 |
| Tennessee | 3,259,560 | $3,223 | 69.6% | 2.58% | $86,869 | 1.9 |
| Virginia | 4,168,070 | $3,205 | 65.2% | 2.04% | $102,403 | 1.6 |
| Massachusetts | 3,595,730 | $3,189 | 63.8% | 1.68% | $121,181 | 1.4 |
| North Dakota | 371,320 | $3,178 | 65.0% | 2.10% | $98,230 | 1.7 |
| Utah | 1,542,530 | $3,169 | 66.1% | 2.22% | $94,540 | 1.7 |
| North Carolina | 4,923,710 | $3,085 | 66.8% | 2.43% | $84,870 | 1.9 |
| Delaware | 507,390 | $3,079 | 67.2% | 2.35% | $87,971 | 1.8 |
| Hawaii | 695,470 | $3,065 | 63.3% | 2.30% | $84,322 | 1.9 |
| Idaho | 884,660 | $3,056 | 64.5% | 2.29% | $86,033 | 1.8 |
| Kansas | 1,366,100 | $3,055 | 66.6% | 2.37% | $85,803 | 1.9 |
| Indiana | 3,241,920 | $3,053 | 71.7% | 2.77% | $78,924 | 2 |
| South Dakota | 444,890 | $3,053 | 65.7% | 2.21% | $90,778 | 1.7 |
| South Carolina | 2,487,890 | $3,036 | 65.6% | 2.47% | $80,554 | 2 |
| Michigan | 4,872,330 | $3,028 | 68.5% | 2.54% | $81,709 | 1.9 |
| Colorado | 3,086,830 | $3,009 | 61.4% | 1.81% | $101,760 | 1.5 |
| New Hampshire | 732,250 | $3,001 | 66.7% | 1.84% | $108,721 | 1.4 |
| Pennsylvania | 6,301,140 | $2,997 | 69.7% | 2.30% | $90,857 | 1.7 |
| Missouri | 2,870,290 | $2,991 | 68.1% | 2.44% | $83,389 | 1.9 |
| New Mexico | 980,620 | $2,958 | 67.4% | 2.87% | $69,542 | 2.2 |
| Iowa | 1,482,000 | $2,950 | 67.5% | 2.31% | $86,119 | 1.8 |
| Kentucky | 1,980,840 | $2,946 | 71.5% | 2.86% | $73,762 | 2.1 |
| Nebraska | 951,450 | $2,898 | 66.2% | 2.19% | $87,477 | 1.7 |
| Rhode Island | 570,860 | $2,893 | 68.1% | 2.26% | $87,336 | 1.7 |
| West Virginia | 777,490 | $2,888 | 74.1% | 3.14% | $68,156 | 2.2 |
| Ohio | 5,678,870 | $2,879 | 70.2% | 2.51% | $80,489 | 1.9 |
| Montana | 553,910 | $2,852 | 62.5% | 2.09% | $85,142 | 1.7 |
| Minnesota | 2,902,640 | $2,808 | 63.8% | 1.89% | $94,936 | 1.5 |
| Oregon | 2,067,600 | $2,758 | 62.5% | 1.96% | $87,932 | 1.6 |
| Wisconsin | 2,944,630 | $2,716 | 66.6% | 2.09% | $86,578 | 1.6 |
| Vermont | 335,140 | $2,691 | 65.1% | 2.09% | $83,766 | 1.7 |
| Maine | 712,110 | $2,608 | 65.8% | 2.12% | $80,888 | 1.7 |
Source: IRS Statistics of Income, Historic Table 2 (individual income tax data by state, all AGI classes), tax years 2019 to 2023. Calculations by SmartTaxCalcs. Retrieved November 4, 2026.
Frequently Asked Questions
Which state gets the largest federal tax refunds?
Texas. In tax year 2023 its refunded returns averaged $3,784, against $3,286 nationally (IRS Statistics of Income).
Which state gets the smallest refunds?
Maine, at an average of $2,608 per refunded return in tax year 2023.
What share of taxpayers get a refund?
66.5% of all federal returns filed for tax year 2023 received a refund, down from 73.2% for tax year 2019. The highest share was in West Virginia (74.1%).
How big is the average refund compared with income?
Nationally, refunds added up to 2.29% of adjusted gross income. The average refund equals about 1.8 weeks of the average AGI per return ($95,243).